A crash minidump file (DMP file) contains various information about the state of the application at the moment of time when it crashed.
Technically, the crash minidump file may contain:
- general system information (OS version, CPU count, etc.);
- blocks of process memory (including values of global variables, the call stack and local variables for each execution thread);
- the list of loaded and unloaded modules (including their versions and timestamps).
Minidump size is typically about several tens of kilobytes, but the actual content of the minidump depends on the minidump type you pass as the value of the CR_INSTALL_INFO::uMiniDumpType field.
To analyze crash minidump files generated by the CrashRpt library, you typically open those files in Visual Studio or in WinDbg. The following two sections of this page describe minidump opening instructions in details:
- Note:
- In order to recover the stack trace from the crash minidump, you need the debugging symbols (program database, PDB) generated by the compiler/linker for modules of your application. You may also need the source code of your application to be able to edit the place in the code where the crash happened.
In order to illustrate how to open a minidump file in Visual Studio, we will use a minidump file created for the
WTLDemo.exe demo application which is distributed with CrashRpt distribution archive.
To create such a minidump, you can follow the steps below:
- Compile (if you haven't yet compiled) the CrashRpt in Release configuration as described on Compiling CrashRpt page.
- Go to the bin directory under the top-level directory of CrashRpt distribution. You can see that Visual Studio has created several EXE and DLL binary files (WTLDemo.exe, CrashRptXXXX.dll, etc.) and PDB files for those binaries (WTLDemo.pdb, CrashRptXXXX.pdb, etc.) The XXXX is the placeholder for the actual version of CrashRpt library.
Finally, you should have a directory structure like this:
- WTLDemo
- 1.4.1
- WTLDemo.exe
- WTLDemo.pdb
- CrashRpt1401.dll
- CrashRpt1401.pdb
- Save the source code of the WTLDemo application to some directory (we will need it later). The source code of the WTLDemo app is located inside of \demos\WTLDemo subdirectory under the top-level directory of CrashRpt distribution.
- Note:
- If you use SVN or another version control system for storing your code, you can just mark the revision with a tag to be able to restore the state of the code at any time.
- Next, go to the bin directory again and run the WTLDemo.exe. When the dialog appears, click the "Crash" button. When Error Report dialog appears, click the "What does this error report contains?" link. Then in the Error Report Details dialog, click the "Export..." button to export the error report files as a ZIP archive. Export your error report to some directory.
- Unzip the error report archive. It contains crashdump.dmp file and several other files.
Now, when you have the crashdump.dmp file, you can open it in Visual Studio. In order to open crash minidump file, double-click its file name.
- Note:
- Alternatively, if you have several versions of Visual Studio installed (for example a commercial one and an Express edition) right-click the filename and in the context menu select Open With and then choose what Visual Studio version to use.
A new Visual Studio window appears displaying general information on the
crashdump.dmp (see the figure below).

Visual Studio: crashdump.dmp
In the Visual Studio window, click the
Debug with Native Only to load the minidump data. When the data has been loaded, you should be able to see the dialog containing information about the exception, such as exception address, module name, exception code and its textual description (see the figure below). Press the 'Break' button to continue.
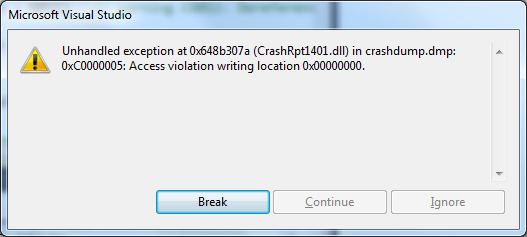
Unhandled Exception Message
In the
Output window, you should be able to see the log of minidump loading progress. If you do not see the
Output window, open menu
View and click the
Output menu item.
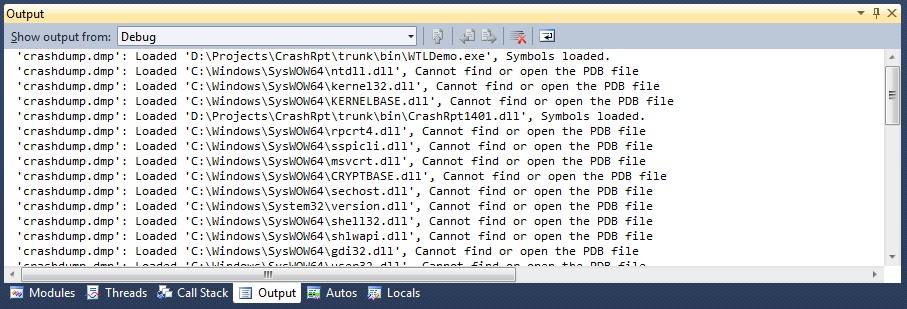
Output Window
Now look at the
Modules window. If you do not see such a window, open menu
Debug->Windows and select the
Modules menu item. Click the
Symbol Status column header twice to sort modules by symbol load status in descending order. Now you should be able to see what symbols have beel loaded for
WTLDemo.exe and
CrashRptXXXX.dll modules.
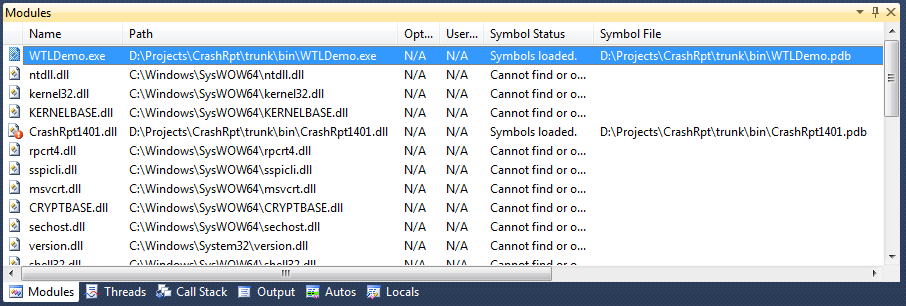
Modules: Symbols load status for each module
As the debug symbols seem to be loaded successfully for the main modules of the application, in the code window (see the figure below) you should be able to see the place in your source code where the exception occurred. We can see that the crash occurred in file
CrashRpt.cpp at line 829 inside of
crEmulateCrash() function because of assigning a null pointer variable with the value 0. If the reason of the crash is clear, you even can edit the source code right in place to fix the problem.
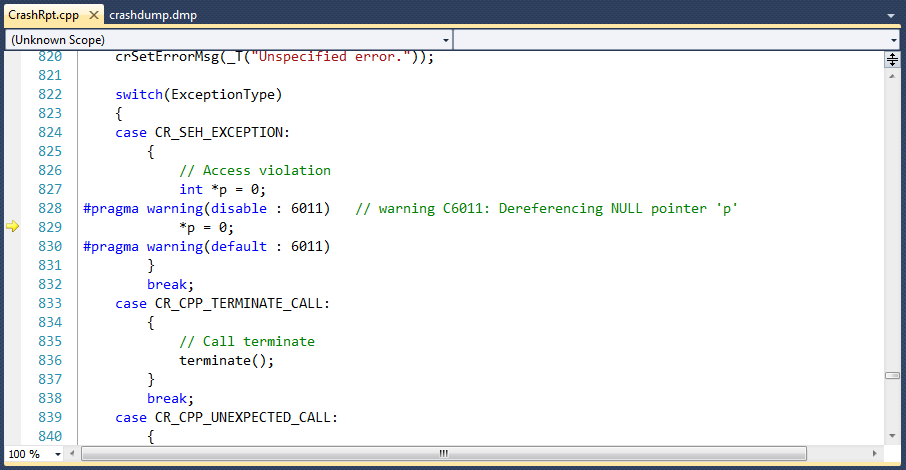
Line of the code where exception occurred
- Note:
- If line numbers are not displayed (this is the default), open menu Tools->Options..., in appeared dialog's tree choose Text Editor->C++, and then set the check mark in the Line numbers field.
You can see the values of local variables by moving the mouse cursor over the variable name. The value (if known) is displayed in a tooltip window. Not all variable's values can be recovered, this depends on the minidump type you use and on other factors, such as code optimizations.
In order to better understand the reason of the crash, we would like to know what C++ class or function called the crEmulateCrash() function and for what purpose. We can do that with the help of the Call stack window (see the figure below). If the Call stack window is hidden, open menu Debug->Windows and select the 'Call Stack' menu item.
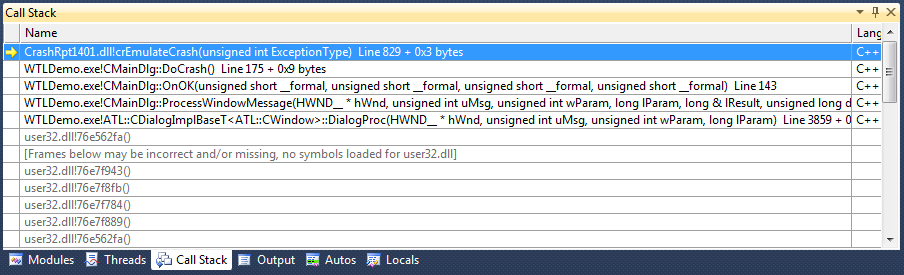
Call Stack
Each line (also called a
stack frame) of the stack trace contains the name of module the code belongs to, the name of symbol (function or class), offset from beginning of symbol code, source file and line number. Moving down the stack, we can see that
crEmulateCrash() was called by the
CMainDlg::DoCrash() class method, which, in turn was called by the
CMainDlg::OnOK() method as the result of button click.
Typically, the program has several execution threads. You can switch between threads using the Threads tab and browse the stack for each thread. We can see that there are two threads in the application: the main thread and the worker thread. The exception occured in the main thread, the second thread didn't crash.
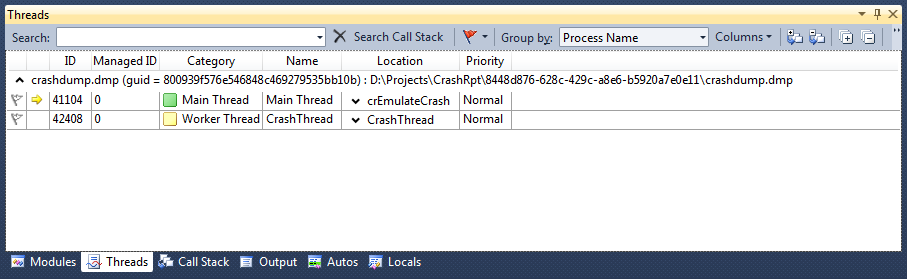
Threads Window
Finally, when you have finished with analyzing minidump data, close the Visual Studio window.
The case described above is the easiest one, because Visual Studio located all binaries, PDB files and source files automatically. But in general, there may be some problems with reading minidumps, when Visual Studio can't locate those files, or when the timestamps of those files do not match.
In order to locate matching binaries, PDB files and source code files, Visual Studio uses the absolute paths embedded into the PDB file at the time of compilation and linking. So, when you do not delete/move/modify the files you used to build the solution, Visual Studio can locate them automatically. But, if you delete/move or modify those files, Visual Studio won't be able to locate them.
In order to illustrate such a case, we will remove the entire bin and \demos\WTLDemo folders containing WTLDemo's source code we used for compilation, together with resulting binaries and PDB files. Then if we open the minidump file again, in the Modules window we will see that the symbols could not be loaded (see the figure below).
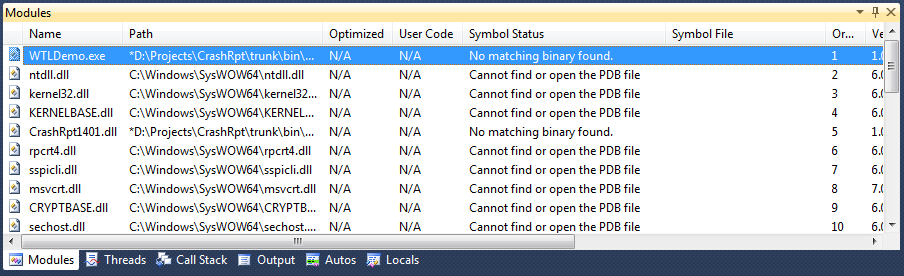
No Symbols Loaded
Symbol status for
WTLDemo.exe and
CrashRpt1401.dll modules shows that there were no matching binaries found. In order to fix this, you should specify symbol search path manually. In the minidump window, click the
Set symbol paths and enter the path to the directory where your PDB files are located (see the figure below for example).
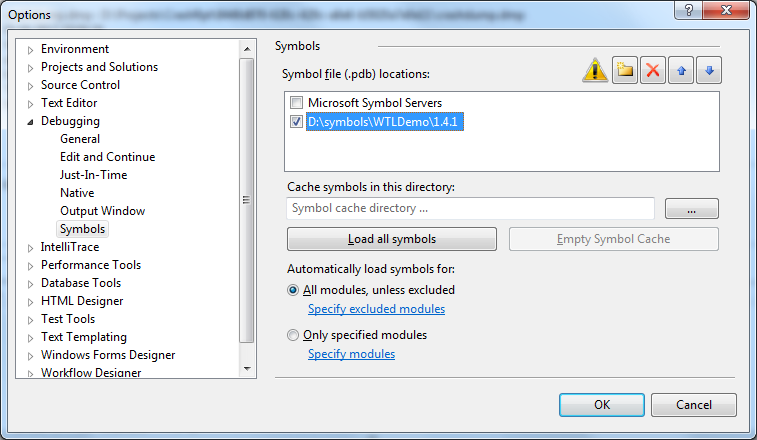
Where to load symbols from
Now reload the minidump. You can see that the stack trace is now recovered correctly. But there is still one problem - the correct source code files are not displayed. In the
Call Stack window, double-click the topmost stack frame. A dialog titled 'Find Source: crashrpt.cpp' will appear. In this dialog, browse to the folder where you saved the source code and pick the
crashrpt.cpp file. Now the correct source file should be displayed in Visual Studio source code window.
At this point, you should be able to read the minidump correctly. If the problem remains, follow the instructions below:
- Ensure that correct matching binaries and/or PDB files were saved after compilation. Ensure you save excatly the same binaries and PDB files that were generated during the compilation/linking process. If you rebuild (or partially rebuild) your solution, you should save those files again.
- If symbols for some modules of your program are loaded, and you are still unable to read the stack trace, than there were no debugging symbols generated for the module where crash had occurred. Check that you set Program Database (/Zi) compiler flag and Generate Debug Info (/DEBUG) linker flag for all modules of your application. For additional info, see Enabling Program Database (/Zi, /DEBUG) in Release Configuration.
- If the stack trace is not as accurate as you expect, the reason may be the code optimizations. It is recommended that you turn the frame pointer omission (FPO) optimizations off.
You can use
WinDbg program from
Microsoft Debugging Tools for Windows for opening crash minidumps. It is freely distributed.
To open the minidump file, launch WinDbg and open the crash dump by pressing CTRL+D key combination. In the appeared Open File dialog, pick the crashdump.dmp and press the Open button. The Command window appears (see the figure below) allowing you to enter commands and see the output.
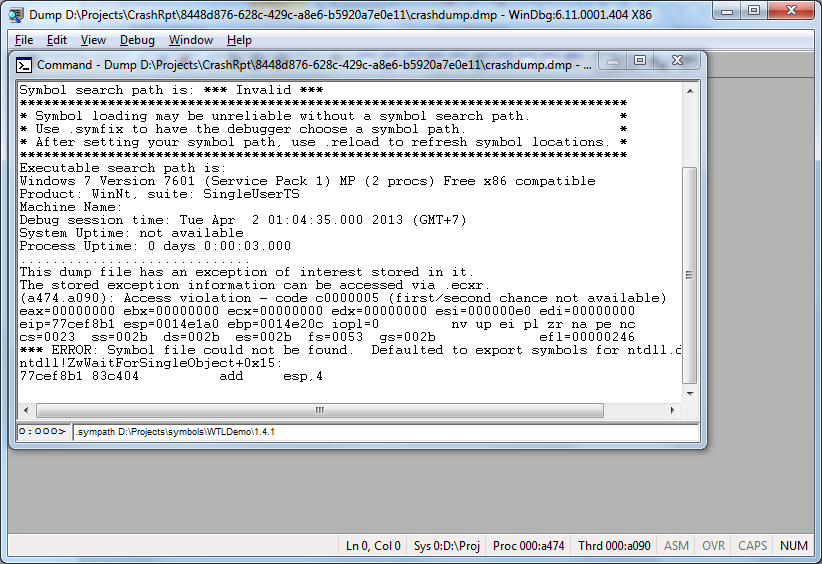
Opening a crash minidump in WinDbg
Next, you need to set the symbol path for WinDbg with the
.sympath command. Switch to the command window (ALT+1) and enter
.sympath followed by a space followed by the semi-colon delimited list of directories to search.
.sympath D:\Projects\symbols\WTLDemo\1.4.1
Similarly you need to set the executable and source search paths with the .exepath and
.exepath D:\Projects\symbols\WTLDemo\1.4.1
.srcpath D:\Projects\WTLDemo
The final step is to change the debugger context to the context record associated with the exception by entering the
If everything is configured correctly, you should now be able to walk the call stack, see local variables, and loaded modules. You can even have WinDbg highlight the offending line of code by double clicking the WTLDemo frame in the Call Stack window (ALT+6). Note: The exact line number may be a little off due to linker optimizations.
Further reading: Automating Crash Report Processing.
 1.5.9
1.5.9